
The Testing Tail Wags the Learning Dog: What We Know About Curriculum Narrowing in the AI Era

The Testing Tail Wags the Learning Dog: What We Know About Curriculum Narrowing in the AI Era

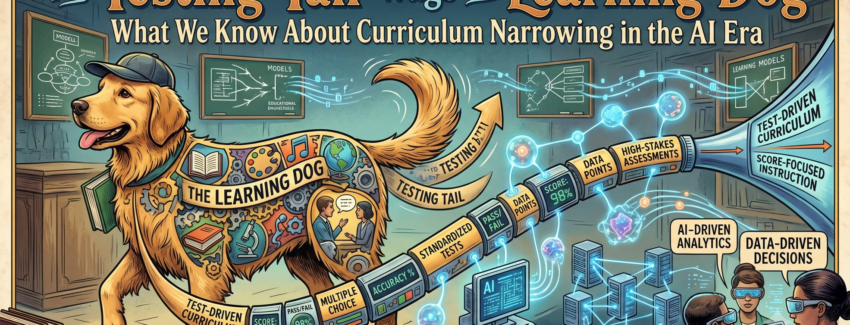
There’s a well-documented phenomenon in education: when stakes attach to test scores, curriculum narrows. Schools teach to the test. Subject areas not on the test—arts, social studies, sciences beyond what’s assessed—lose instructional time. Teachers focus on measurable skills. Deeper, messier, less-testable forms of learning get compressed.

This is old news. What’s new is the feedback loop: standardized assessment pressure now feeds directly into AI-driven content recommendation systems. And when an algorithm is trained to optimize for what gets tested, it doesn’t just recommend narrower content. It makes narrowing feel like personalization.

The result is a form of curriculum collapse that’s harder to see than the old version—because it looks like choice, and because it operates at scale, invisibly, in thousands of classrooms simultaneously.

How We Got Here

The narrowing problem predates AI by decades. High-stakes testing—NCLB accountability measures, state standardized tests, college admissions tests—created perverse incentives. Schools in under-resourced districts especially faced pressure to allocate time to tested subjects. Time spent on science lab work, historical argumentation, or artistic practice was time not spent on test prep.

The research on this is solid. Curriculum narrowing is real. It’s largest in lower-income schools and schools serving students of color. And it correlates with lower long-term outcomes, even as short-term test scores rise.

But the narrowing was at least transparent. A principal could say: “We’re spending more time on reading and math because that’s what’s tested.” A teacher could push back: “But my students need science and history too.” There was friction. There was visibility.

Now add AI-driven content recommendation. These systems—used in adaptive learning platforms, tutoring apps, and increasingly embedded in LMS environments—are trained on massive datasets of student interaction and outcomes. The systems learn: when students engage with content on this topic, and then take a test on this topic, they score higher.

So the algorithm recommends more of that content. And less of everything else.

The problem deepens when you consider what data these systems are trained on. In most cases, it’s outcomes from standardized assessments. A student’s “success” is often defined as test score improvement. So the algorithm optimizes for that. It learns to recommend content that correlates with higher test performance, and to de-prioritize everything else.

This is mathematically rational. It’s also educationally catastrophic.

The Personalization Illusion

The mechanism is subtle enough that it doesn’t feel like narrowing. It feels like personalization.

An adaptive platform sees that a student struggles with fractions. So it recommends more fraction problems. This is good—targeted practice on a weakness. But the algorithm also learns that this student’s test scores correlate most strongly with procedural fluency in fractions, not with conceptual understanding of rational numbers. So it recommends procedural practice, not conceptual exploration.

The student gets more practice problems. The student’s test scores go up. The platform is “working.” But the student hasn’t learned what fractions mean in different contexts—how they show up in recipes, in probabilities, in music. That’s deeper learning. It’s harder to measure. The algorithm doesn’t optimize for it.

Scale this across a curriculum. A student “struggles” with essay writing, so the platform recommends more templates and formulaic exercises. It doesn’t recommend reading challenging essays, because reading doesn’t directly improve writing test scores in the short term. A student shows low engagement with history, so the platform deprioritizes history content in favor of subjects with higher engagement-to-test-score correlation.

The algorithm is doing exactly what it’s designed to do: maximize measurable performance. But in doing so, it collapses the curriculum into the testable, the measurable, the short-term-scoreable.

And here’s the kicker: because this happens at the level of algorithmic recommendation, it’s nearly invisible. A teacher might not realize that the platform is systematically steering her students away from certain topics. The system presents it as “personalized learning path.” The student experiences it as “recommended for you.” Nobody sees the narrowing happening.

The Interaction Effect

The problem gets worse when you consider how AI recommendation interacts with existing assessment pressure.

In a traditional system: teacher experiences pressure to raise test scores, so teacher de-emphasizes untested subjects. At least there’s a human decision-making point. A teacher might resist. A department might push back. A principal might allocate protected time for science or arts despite testing pressure.

In an AI-mediated system: the pressure is baked into the algorithm. The recommendation engine doesn’t “de-emphasize” untested subjects. It simply doesn’t recommend them as often. Over a school year, a student might see 30% less history content, 40% less science exploration, not because anyone decided this, but because the algorithm’s training data showed that those topics don’t correlate as strongly with test score improvement.

And because the system is adaptive—it’s continuously learning from each student’s interaction—it’s continually tightening the curriculum around what’s tested. There’s no static decision point to push back against. The narrowing is dynamic, personalized, and largely invisible.

Teachers also can’t easily override it. If a platform is recommending content algorithmically, a teacher would have to manually curate every student’s learning path to ensure breadth. Most don’t have time. Most don’t even know it’s happening.

What the Data Shows

There’s limited research on this specific phenomenon—AI-driven narrowing in real classrooms—because most of these systems are relatively new and proprietary. But early evidence is concerning.

Studies of adaptive math platforms have found that while they improve performance on practice problems and immediate assessments, they don’t improve transfer to novel problems or conceptual understanding. Students get faster at the narrow skill the algorithm optimized for. They don’t get better at thinking mathematically.

Research on algorithmic recommendation in other domains (social media, e-commerce, news) consistently shows that recommendation systems narrow the range of content users encounter. They create filter bubbles. Algorithms are biased toward engagement and measurable outcomes. Breadth and serendipity are not optimizable.

There’s no reason to think educational algorithms are different.

And there’s indirect evidence from learning sciences: deeper learning—the kind that transfers, that connects across domains, that builds genuine understanding—requires exposure to multiple representations, contexts, and disciplines. It requires “productive struggle” with ideas that don’t immediately connect to testable outcomes. It requires time for exploration, question-asking, and intellectual wandering.

All of these are precisely what narrowed curricula and AI-optimized pathways eliminate.

The Equity Dimension

This matters most for students who are already underserved by assessment-driven education policy.

In high-poverty schools, curriculum narrowing has been documented for years. Limited resources mean hard choices about what gets taught. And because accountability pressure is heaviest in schools serving low-income students and students of color, those schools narrow first and narrowest.

An AI system trained on data from these schools will learn the narrowed curriculum as “optimal.” It will recommend that same narrow path to new students. It will do so at scale, in the name of personalization and efficiency.

For affluent students, there’s often a safety valve: private schools, enrichment programs, cultural capital at home that supplements school. For students in under-resourced schools relying on the platform? The algorithm is the curriculum. And the curriculum is whatever the algorithm learned to optimize for.

This is algorithmic reproduction of inequality. It’s not malicious. It’s mechanical. It’s exactly what you’d expect from a system trained to optimize for test scores in a context where test score pressure falls unevenly across schools.

What Institutions Need to Do

If you’re adopting or using adaptive learning platforms, here’s what matters:

Audit what “success” means in the platform’s training data. Ask the vendor: What outcomes did you optimize for? If the answer is “test score improvement,” push back. Insist on training data that includes longer-term outcomes, transfer, and measures of conceptual understanding—even if those are harder to quantify.

Mandate breadth floors. If a platform is recommending content algorithmically, establish non-negotiable minimums for curriculum breadth. Students should encounter history, science, arts, and social-emotional content even if the algorithm predicts lower test score gains. Pedagogy isn’t just about optimization.

Make the algorithm’s recommendations visible to teachers. If an algorithm is steering a student’s learning path, teachers need to see it. Not as a black box (“your student’s personalized learning path”), but as: “The system is recommending 60% math, 20% reading, 15% science, 5% other because these correlate with higher assessment performance.” Then teachers can decide whether that’s educationally sound.

Resist the efficiency argument. Adaptive systems often promise to “save time” by focusing students only on what they need to improve. But time spent on breadth, exploration, and deeper understanding is not wasted time. It’s the foundation of actual learning. If the platform can’t account for that, it’s not actually saving time—it’s just narrowing what you measure as time well-spent.

Build in counterbalance. If you’re using AI-driven recommendation for part of learning, use human-designed, breadth-forward curriculum for the rest. Don’t let the algorithm drive the whole learning experience. Use it as one tool among many, not as the curriculum itself.

The Bigger Picture

The narrowing problem is old. Assessment-driven incentives are old. What’s new is the scale and invisibility of algorithmic optimization.

We’ve known for thirty years that high-stakes testing narrows curriculum. Teachers have resisted it. Some schools have protected space for unmeasured learning. Some systems have pushed back against the worst accountability excesses.

An algorithm doesn’t resist. It optimizes. It operates at scale without friction. And it feels like personalization because it’s tailored to each student—even as it’s systematically narrowing what all students encounter.

The question isn’t whether to use adaptive learning systems. They’re here. The question is whether we’ll implement them in ways that respect curriculum breadth, or whether we’ll let them become just another mechanism for teaching only what we can test.

History suggests we’ll choose the latter unless we’re deliberate about choosing otherwise.

Why Your LMS Implementation Failed (And Why the Next One Will Too)

Why Your LMS Implementation Failed (And Why the Next One Will Too)

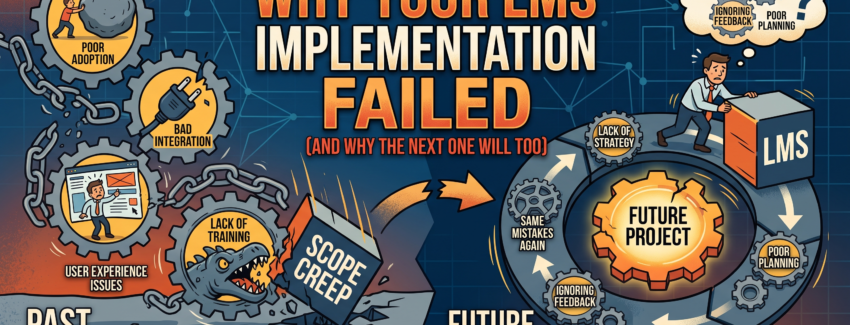
Your institution just wrapped a $400,000 LMS migration. The vendor promised integration. The implementation partner promised change management. The steering committee promised adoption. Six months in, teachers are uploading PDFs to a digital filing cabinet and students are still emailing assignments to their instructors. The platform is failing. Or so the story goes.

The platform isn’t failing. Your institution is implementing it as a control system when it should be implementing it as a teaching system. And until that structural orientation changes, your next LMS will fail for exactly the same reasons.

The Control Orientation

When an institution implements an LMS, it rarely asks: “How does this platform help teachers teach?” Instead, it asks:

  • Can we track student time-on-task?
  • Can we ensure compliance with course structure requirements?
  • Can we standardize course shells across departments?
  • Can we measure completion and reduce accreditation risk?
  • Can we reduce instructor workload through automation?

These are all legitimate institutional concerns. But notice what they have in common: they’re not about learning. They’re about visibility, standardization, compliance, and control. The LMS becomes an infrastructure for managing institutional risk and regulating teacher behavior, not for supporting teaching practice.

Teachers know this immediately. They feel the platform’s actual purpose in its design: the mandatory course structure modules you can’t customize. The grade book that’s optimized for data extraction, not feedback. The discussion forum that captures institutional liability but constrains genuine dialogue. The analytics dashboard that measures engagement as proxy for learning—because actual learning is hard to quantify and harder to control.

So teachers do what they’ve always done: they work around the system. They use email for real communication. They hand-grade high-stakes assignments instead of using the built-in tools. They keep their real course materials in Google Drive. They conduct live Zoom sessions because the asynchronous framework doesn’t fit their pedagogy. The LMS becomes a compliance layer they perform for, not a tool they use.

And the institution interprets this as adoption failure. “If only teachers would buy in,” administrators say. “If only we trained them better.” If only we made the interface simpler. If only we mandated submission through the LMS.

The adoption isn’t failing. The orientation is.

What Teaching Infrastructure Actually Requires

A teaching infrastructure starts with a different question: What do teachers need to do their best work?

Teachers need to give feedback—not summarize it in a gradebook, but actually communicate with students about their thinking, their growth, their next steps. That feedback is often asynchronous (written), but it’s always directional and responsive. A teaching infrastructure makes that easy and natural.

Teachers need to understand where their students are. Not surveillance-level tracking of login times and page views. Understanding. What misconceptions are live in the room? Which students are struggling with this particular concept? Who’s ready to move ahead? A teaching infrastructure surfaces this through tools that capture authentic learning signals—student work, questions, mistakes—not proxy metrics.

Teachers need to iterate quickly on their practice. They need to try something, see how students respond, adjust, try again. This happens at the pace of a class or a unit, not at the pace of an academic calendar. A teaching infrastructure assumes experimentation and makes it low-friction.

Teachers need to honor the rhythm and depth of their discipline. A history teacher’s inquiry-driven seminar looks nothing like a statistics course or a language class. A teaching infrastructure adapts to disciplinary practice instead of forcing all courses into a uniform structure.

Teachers need autonomy with accountability. They need space to make pedagogical choices—how to sequence material, how to group students, what counts as evidence of learning—while being accountable for that work. A teaching infrastructure trusts teachers while making their practice visible.

None of this is particularly controversial. But it requires an LMS designed around teaching instead of around institutional risk management. And that’s almost never what institutions buy.

Why This Keeps Happening

There are a few reasons this structural mismatch persists.

First, buying committees rarely include practicing teachers. Decisions are made by administrators, IT staff, and accreditation offices—people whose primary concern is institutional stability, not pedagogical quality. Teachers are invited to “input sessions” after the platform is already chosen.

Second, implementation is outsourced. Vendors and implementation partners have an incentive to position the LMS as the solution to institutional problems: “Use our gradebook tool and reduce grading time,” “Use our analytics and identify at-risk students,” “Use our content library and ensure consistency.” These are control promises, not teaching promises. The vendor can deliver them. Nobody can promise that a platform will make teachers better at their craft—that’s on the teacher, not the tool.

Third, success is measured wrong. Adoption metrics reward compliance: course shells created, assignments submitted through the platform, grades entered by deadline. None of these measure whether teaching got better. And because they’re easy to measure, they become the actual goals. You optimize for what you measure, and institutions measure institutional control.

Fourth, there’s a funding alignment problem. The people who allocate budget—provosts, deans, IT directors—benefit from a platform that centralizes data and enforces standardization. The people who would benefit most from a teaching-first infrastructure—faculty and students—have minimal budget power.

The Practical Path Forward

If you’re facing an LMS decision or living through a failing implementation, here’s what matters:

Ask different questions in procurement. Don’t ask “Can this platform track student engagement?” Ask “Can a teacher use this to give meaningful feedback easily?” Don’t ask “Does it enforce course structure compliance?” Ask “Does it let teachers design for their discipline?”

Include practicing teachers on the steering committee. Not as advisors. As decision-makers. Their pedagogical judgment should outweigh institutional risk management in design choices.

Measure what actually matters. Track instructor use of features designed for teaching (feedback tools, formative assessment), not compliance (course shells created). Ask teachers annually: “Did this tool help you teach better this year?” Listen to the answer.

Protect autonomy. Whatever platform you adopt, establish clear boundaries: teachers can customize course structure, teachers choose their own assessment tools, teachers decide what goes in the gradebook. Make this non-negotiable. Institutional standardization is cheaper than pedagogical quality, but you can’t have both.

Accept lower adoption on compliance features. If teachers route around your LMS’s discussion forum because they find real learning happens in live dialogue, that’s not a failure. That’s information. It means your infrastructure isn’t serving teaching.

None of this requires a different LMS. Canvas, Blackboard, Moodle, D2L—the platform matters less than the orientation. You can have a control-focused infrastructure on any platform. And you can have a teaching-focused one too.

The question is which one your institution actually wants.

Why Teachers Are Becoming Data Analysts (And Why That’s Wrong)

Why Teachers Are Becoming Data Analysts (And Why That’s Wrong)

The Scene

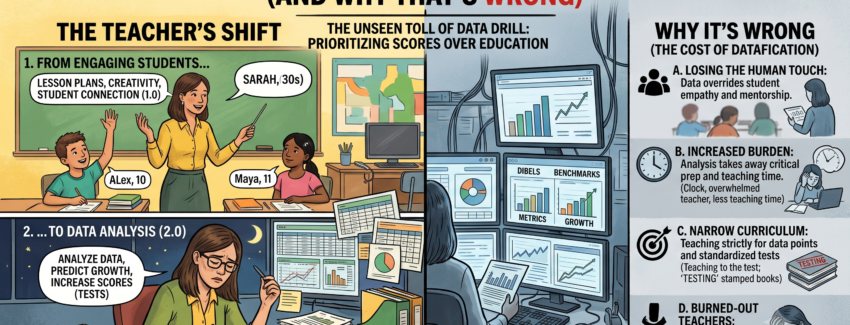
It’s 7 a.m. on a Tuesday. A high school English teacher sits in an empty classroom with her laptop open. She has 90 minutes before students arrive. This time used to be for lesson planning, creating handouts, or just breathing. Now it’s for data work.

She’s reconciling data across four systems. Last week, the LMS showed that 23 students hadn’t completed the reading response. But the SIS gradebook shows only 19 missing assignments—four students submitted work late, and the grade got recorded but the completion flag in the LMS didn’t update. Meanwhile, an assessment platform she used for a quiz shows different numbers because it only counts students who took it on the platform; three students took a paper version that hasn’t been entered yet.

So which number is real? She doesn’t know. She spends 45 minutes manually cross-checking, noting discrepancies in a spreadsheet, trying to figure out who actually needs intervention and who just needs her to fix the data.

Then she looks at the dashboard her instructional coach sent yesterday—a summary of “priority students.” Twelve names are flagged for reading intervention based on an algorithm. She knows most of these students. She knows why they’re struggling: one is dealing with housing instability, one has undiagnosed dyslexia, one just transferred from a school where they read at a different level, one has severe anxiety about reading aloud. The algorithm doesn’t know any of this. It just knows that their assessment scores are low.

She spends 30 minutes writing a note back to her coach explaining the context for each student, essentially translating human reality into the language the system can’t speak.

By the time students arrive, she’s already exhausted. She hasn’t prepared tomorrow’s lesson yet.

This is not her job. But it has become her job.


The Invisible Restructuring

No one explicitly told teachers to become data analysts. There was no announcement: “Starting next year, you will spend 5–10 hours a week interpreting dashboards, reconciling records, and translating between incompatible systems.”

It happened gradually, through a series of small implementations. A new LMS. Then an assessment platform. Then a behavior tracking system. Then a predictive analytics tool. Then an attendance app. Each one was supposed to make things easier. Each one created new data. And someone had to manage it.

That someone was the teacher.

This is the hidden restructuring of teacher work that no one talks about. We talk about ed tech adoption rates, implementation fidelity, ROI. We measure whether teachers are using the platforms. We don’t measure what that use costs—not in dollars, but in time, in cognitive load, in the actual work of teaching.

Here’s what has actually happened:

Schools bought systems that cannot function without constant human interpretation. These systems generate data that contradicts other data. They flag things that aren’t actually problems. They hide things that are. They require someone—a human with judgment, context, and institutional knowledge—to manage the gap between what the system says and what’s actually true.

That gap is enormous. And teachers have been drafted to manage it.

The ed tech industry solved this brilliantly. Instead of admitting that their products require technical infrastructure and skilled data management, they reframed the work as teaching. “Data-driven instruction.” “Evidence-based practice.” “Using data to inform teaching decisions.” Suddenly, the unpaid labor of keeping the system functional became a professional expectation.

Schools loved this too. They got infrastructure maintenance for free. Teachers would do it because they care about their students and want to use data well. No need to hire a data analyst, a database administrator, or a systems manager. Just train the teachers and let them figure it out.

This is a masterclass in labor extraction dressed up as professional development.


The Real Work No One Accounts For

Let’s be precise about what teachers are actually doing. Data analyst work includes:

Data reconciliation. When systems don’t sync, teachers manually match records. A student submits an assignment in Google Classroom, but it has to be recorded in the SIS gradebook for accurate GPA calculation. The LMS doesn’t talk to the SIS, so the teacher has to manually enter it. Multiply this by 150 students and 40+ assignments per term. That’s hundreds of manual data entries.

Interpretation and translation. A report from an assessment platform uses specialized language (“Lexile level,” “growth percentile,” “mastery threshold”). A parent meeting is coming. The teacher has to translate this into language parents understand, then translate parental concerns back into the language the system understands, then figure out what to actually do about it.

Error detection and correction. A student is marked absent when they were present. A quiz score was recorded as zero when they never took it. A behavior incident was logged under the wrong student. Teachers catch these errors because they know their students and remember what actually happened. They spend time reporting errors, waiting for IT to fix them, or manually correcting records.

System maintenance. Updating gradebook settings so that weighted grades calculate correctly. Adjusting assessment alignments so that data connects to standards. Re-entering student data when a system migration doesn’t transfer properly. This is IT work. Teachers are doing it.

Report generation and data presentation. Teachers create custom reports because the platform’s built-in reports don’t show what they need. They build spreadsheets. They make charts. They synthesize data from multiple dashboards into a coherent picture for a parent conference, an IEP meeting, or an intervention plan.

Validation and sense-checking. Does this data make sense? A student’s engagement score dropped 40 points overnight—did their behavior change, or did the platform’s algorithm change? A predictive alert says a student is at risk, but they’re passing the class—which one is right? Teachers use their knowledge to figure out whether the data is trustworthy.

Documentation. Writing notes about why a student was flagged, what interventions were tried, what the data shows. This creates a paper trail—ostensibly for accountability, but also for liability protection. Teachers spend time documenting not because it helps them teach better, but because the institution needs the documentation.

The Bureau of Labor Statistics doesn’t have a line item for this. It doesn’t show up in official teacher workload calculations. Schools don’t budget for it. Researchers don’t measure it. But if you add it up across a faculty, it’s the equivalent of hiring 1–2 full-time data analysts and paying them zero dollars.


Why This Happened (And Why It’s So Hard to See)

This didn’t happen because ed tech companies are evil, or because district leaders are trying to exploit teachers. It happened because of a structural misalignment that makes sense from everyone’s perspective—until you zoom out and see the whole pattern.

From the ed tech company’s view: We built a platform. It requires data to be accurate and interpretable. We could employ customer success managers to do this for every school. That’s expensive. Alternatively, we could frame it as a teaching skill and assume schools will make teachers do it. Much cheaper for us.

From the district administrator’s view: We bought this platform because it promised to improve instruction through data. The vendor says teachers need to be trained on how to use it. We’ll add professional development. We won’t hire new staff because we don’t have budget for that. Teachers will absorb the new work because that’s what professionals do. We can even call it “instructional leadership” and make it a job expectation.

From the principal’s view: I’m being evaluated on whether my school is using the platform and improving data practices. I’ll encourage teachers to spend time with it. I’ll make it a priority during meeting time. I can’t hire someone to manage it. But I can ask teachers to step up.

From the teacher’s view: I want to teach better. If data helps me understand my students, I should use it. The district is asking me to do this. This is probably just part of being a professional now. It’s hard and time-consuming, but it’s for the kids.

Each perspective is rational. But together, they create a system where:

  • Teachers do work that should be done by trained data professionals
  • That work is invisible in budget, policy, and hiring decisions
  • It gets justified as “professional practice” rather than recognized as labor
  • The responsibility for making bad systems work falls on the people least paid to do it
  • No one is accountable if the system fails or the data is wrong

This is especially insidious because it’s coded as empowerment. Teachers are told they’re becoming “data-driven” professionals. They’re becoming more analytical. They’re using evidence. It sounds good. It feels professional.

But professional doesn’t mean unlimited volunteer labor. Professional means compensation, expertise development, reasonable workload, and accountability for outcomes. What’s actually happening is the opposite: teachers are doing infrastructure work, without training, without time, without support, and without recognition.


The Gendered Dimension No One Mentions

There’s something else happening that deserves to be named.

Teaching is a feminized profession. About 80% of K–12 teachers are women. And for decades, teaching has been understood culturally as care work—emotional labor, relationship-building, going the extra mile. Teachers aren’t supposed to clock out. Teachers are supposed to care, sacrifice, do what’s needed.

Now add another layer: data management. Who does that? Disproportionately, women teachers. Who gets pulled into “data talks” and asked to track metrics? Disproportionately, elementary teachers (who are more likely to be women). Who spends Saturday mornings reconciling spreadsheets to prepare for parent-teacher conferences? Often women who internalize the message that they should handle it themselves because “that’s what good teachers do.”

Meanwhile, the actual infrastructure work—the database design, the system architecture, the algorithmic decisions—is done by (disproportionately male) engineers in ed tech companies and IT departments who are paid well for it.

This is a gender pattern. Care work is being transformed into data management work, and it’s still being done by women, still unpaid or underpaid, still framed as professional duty rather than labor.

That’s a problem worth naming directly.


What Actually Needs to Happen

The solution is not better data literacy training. Teachers need to know how to read data, yes. But that’s not the same as teachers being responsible for managing data systems.

Here’s what needs to change:

Someone needs to own data infrastructure. Every school should have a dedicated person—ideally a data manager or systems coordinator—whose job is to ensure that systems talk to each other, that data is accurate, that discrepancies are caught and corrected. This person should have actual expertise in databases, systems integration, and data quality. They should be paid a professional salary. This is infrastructure work. Infrastructure requires specialists.

Teachers should read data, not manage data. Teachers should spend time interpreting reports and thinking about what data means for their instruction. That’s professional work. Teachers should not spend time entering data, reconciling systems, generating reports, or chasing down errors. That’s technical work.

Systems should be designed so that humans don’t have to do this work. When you have to manually reconcile data across systems, that’s a system design failure. When you have to translate specialized reports into human language, that’s a design failure. When you spend time catching errors that a system should catch, that’s a design failure. Schools and districts should demand better. Ed tech companies should build systems that don’t require continuous human repair.

Workload needs to be explicitly negotiated. If teachers are asked to do new work, that should be added to job descriptions and compensated. Time should be carved out in the school day. Responsibilities should be clarified. Right now, it’s all assumed and invisible.

Data governance needs to be a school priority. Who decides what gets measured? Who owns the dashboard? Who is accountable when data is wrong? How are privacy and bias being managed? These decisions should be made deliberately and collectively, not by default. Schools should have data governance structures—committees that include teachers, administrators, and actual data professionals.

Training should go to specialists, not teachers. If teachers need to understand data fundamentals, yes, train them. But don’t expect teachers to become data analysts. The deep technical work should be done by people trained and hired for that role.

Vendors should be held accountable for usability. If a platform requires constant human interpretation to function, that’s a product failure. Ed tech companies should invest in making systems work without requiring teachers to debug them constantly. If they can’t do that, they shouldn’t sell to schools.


The Hard Truth

Teachers became data analysts because no one wanted to pay for data analysts. Schools got cheap infrastructure by asking teachers to provide it. Ed tech companies simplified their business model by outsourcing the hard work to their customers’ workforce.

It’s efficient. It’s also extractive.

And it’s made teaching harder, not easier. Because every hour a teacher spends reconciling data is an hour not spent planning a better lesson, responding to a student email, or just thinking.

The real irony is this: schools bought these platforms to make teaching more data-informed. Instead, they’ve made teaching more data-consumed. Teachers are drowning in dashboards and data management. The platforms that were supposed to free them to teach better have made it harder to find time to teach at all.

This doesn’t need to be the case. But fixing it requires naming it clearly: what’s happening is labor extraction, not professional development. Teachers are doing work they shouldn’t have to do. That work should be valued, compensated, or eliminated through better system design.

Until schools are willing to hire data professionals and demand that vendors build better systems, teachers will keep waking up early to reconcile databases and translate errors and make broken systems work.

And no one will count that as part of their job.


Related Reading

  • “The Data Literacy Crisis in Schools” — on why teachers can’t interpret data when systems are poorly designed
  • “What Teachers Actually Need from an LMS” — practical framework for evaluating whether platforms reduce or increase teacher workload
  • “The LMS Trap” — on how learning platforms can distort institutional priorities
The Data Literacy Crisis in Schools

The Data Literacy Crisis in Schools

The Paradox

Teachers have more data about their students than ever before. Student information systems track attendance, grades, and behavioral incidents. Learning management platforms log assignment submissions, discussion forum activity, and time-on-task metrics. Assessment tools generate granular performance reports broken down by standard, skill, and question type. Personalized learning systems offer real-time adaptive dashboards. Predictive analytics platforms flag at-risk students before they fail.

And yet, in most schools, this data sits unused, misinterpreted, or—worse—used to make decisions that harm student outcomes.

The problem isn’t the lack of data. It’s that teachers, administrators, and instructional leaders lack the literacy to read it well.

What Data Literacy Actually Means

When people talk about “data literacy” in schools, they usually mean one of two things: learning to use the software interface, or learning statistics. Neither is sufficient.

True data literacy means understanding:

1. Where the data comes from. What are the assumptions built into how it’s collected? A grade in an LMS isn’t just a measure of mastery—it’s entangled with homework completion, late policies, extra credit, participation benchmarks, and the teacher’s grading philosophy. When you glance at a dashboard and see “78%,” that number is a summary of dozens of decisions, each of which shifted its meaning. Most teachers don’t examine these assumptions.

2. What the data can and cannot tell you. An assessment report might show that 65% of students met a learning standard. That sounds clear. But met it how? Through direct instruction, peer collaboration, a single quiz attempt, or multiple formative checkpoints? Did all students see the same assessment, or were there adaptive variations? If you can’t answer these questions, you’re interpreting a metric in a vacuum.

3. How to spot when data conflicts with reality. A student’s LMS dashboard shows high engagement—they’ve submitted all assignments, watched all videos, completed all quizzes. But in class, they’re silent, confused, and behind. Which data is true? Both. And the contradiction is the signal. Yet many schools train teachers to trust the dashboard and overlook what they see.

4. How power and incentives shape what gets measured. Schools measure what’s easy to count, not what matters most. Behavioral incident reports proliferate. Time-on-task metrics explode. But how much data do you have on whether students actually want to learn, whether they see meaning in what they’re doing, or whether they’re developing resilience? The data you have reflects institutional priorities, not educational ones.

5. How to live with uncertainty. A predictive alert says a student is at risk of failing. But the model was trained on last year’s data, in different circumstances, with different teachers. The alert is probabilistic, not deterministic. Yet schools often act as if these alerts are facts, triggering interventions based on an estimate.

None of this appears in the typical “data dashboard training” schools run in August.

Where Teachers Are Left Hanging

Here’s what typically happens:

A principal rolls out a new SIS or assessment platform. IT provides a 2-hour training on how to access reports. Teachers learn to click the right buttons. They’re told, “Here’s where attendance lives, here’s where grades go, here’s the assessment data view.” And then they’re expected to use it.

Within weeks, problems emerge:

Fragmentation. A teacher uses the SIS to track attendance and grades, the LMS to monitor assignment progress, a separate assessment tool for formative data, a behavioral incident app for discipline, and maybe a special-needs platform for IEP tracking. None of these systems talk to each other. A student might show strong LMS engagement but failing grades and rising behavioral flags. Are these related? The systems don’t tell you. The teacher has to manually reconcile four different datasets in their head.

Contradictory narratives. The assessment platform says a student has “mastered” a standard based on a single quiz score. The LMS shows they haven’t attempted the follow-up practice. The teacher’s grade book has them at a D in the class. Which one reflects the student’s actual understanding? Teachers often default to the grades—the thing parents see—even if that metric is muddier.

Invisibility of assumptions. A dashboard report shows “75% of students have not completed Unit 3 by the target date.” This looks like a performance problem. But the “target date” was set by someone in the district office, not by classroom teachers. The teacher might know why pacing had to shift (students needed more time on Unit 2, unexpected absence, a snow day, a substitute day where little learning happened). The dashboard doesn’t know this. It just flags a red zone. The teacher interprets it as a failure, even though the slower pace was deliberate and sound.

False precision. Predictive analytics platforms love to quantify. “This student is 72% likely to drop out.” What does 72% mean? If you had 100 students with the exact same profile last year, 72 would have dropped out? Probably not. The model is far noisier than that. But the number feels authoritative, so interventions get triggered on the basis of something that’s really an estimate plus error bars plus assumptions. Teachers are rarely trained to see the uncertainty.

Pressure to act on incomplete information. Administrators expect teachers to use data to “inform instruction.” But the data is often insufficient. A low formative assessment score might indicate lack of understanding, lack of engagement, a misaligned question, test anxiety, or just a bad day. Without qualitative context, you can’t tell. Yet schools often expect teachers to pivot instruction or trigger interventions based on one data point, creating churn and wasted effort.

The Real Cost

This data literacy gap doesn’t just create frustration—it leads to decisions that harm student outcomes.

Over-intervention. A student is flagged as at-risk by a predictive algorithm. They get pulled into an intensive intervention program. The intervention itself is disruptive—fewer electives, more testing, different instruction. The student feels singled out. Their engagement actually drops. A data point that was probabilistic and uncertain triggered a cascade that made things worse. This is especially harmful for students from historically over-monitored groups, who are already subject to surveillance bias.

Teaching to proxies. When teachers don’t understand what a metric actually measures, they optimize for the metric instead of the goal. If a dashboard emphasizes “time on task,” teachers maximize minutes spent in the LMS, not depth of thinking. If an assessment platform rewards completion, students rush through problems to hit targets. If attendance algorithms predict failure, schools crack down on absences for medical appointments and mental health days, prioritizing the proxy over actual wellbeing.

False confidence in bad data. A curriculum director makes a district-wide pacing decision based on aggregate assessment data from last year. The data looks clear—students struggled with Unit 4. So Unit 4 gets compressed into three weeks instead of four. But the director doesn’t know that last year’s Unit 4 came after a major disruption, or that a high-turnover department had inconsistent teaching quality, or that the assessment itself was poorly aligned to instruction. The data aggregates away these contextual realities. This year, students struggle more, because the root causes were never understood.

Invisibility of equity gaps. Data dashboards can hide systemic inequities. An aggregate report shows “72% of students met the standard.” Sounds solid. But a disaggregated view shows 85% of students in advanced classes met it, while only 58% in general education classes met it. Within general education, 65% of white students and 45% of students of color met it. Yet many schools don’t disaggregate regularly, and when they do, they’re not trained to see these patterns as systemic. They interpret it as individual student deficits, not structural ones.

Why Schools Haven’t Solved This

The data literacy gap is not new. Schools have been collecting data for decades. So why hasn’t this been solved?

No one is accountable for data quality or interpretation. IT owns the systems. Data teams (if they exist) own the dashboards. Teachers own the classrooms. Administrators own the decisions. But no one owns the process of ensuring that data is interpreted well. Schools pay millions for platforms but almost nothing for helping humans understand what the data means.

Professional development is treated as a checkbox. A vendor trains teachers on their platform during a PD day. The training is tool-focused, not literacy-focused. Teachers learn to click, not to think. No one follows up. There’s no ongoing support, no space to practice, no accountability for changing how teachers actually use data.

Incentives are misaligned. Districts are incentivized to adopt platforms—they signal investment, rigor, and innovation. They’re not incentivized to ensure the platforms are used well. Vendors are incentivized to sell dashboards, not to ensure users understand them. Schools are incentivized to look data-driven, not to actually be data-informed. The pressure is toward accumulation and display, not toward literacy and care.

Data literacy is genuinely hard. Understanding assessment design requires some background in psychometrics. Understanding how predictive models work requires some statistics. Understanding how power shapes what gets measured requires some critical thinking about institutions. These are not easy things. Schools don’t pay teachers enough to expect them to do this work on top of everything else, and they don’t provide the time or support to develop this expertise collectively.

Teachers don’t trust the data. And they shouldn’t. The data has been wrong before. A new platform gets rolled out and suddenly grades shift. An assessment is poorly designed. A report doesn’t match what the teacher sees in the classroom. Over time, teachers learn to discount the data and trust their own observations. This is reasonable. But it creates a brittle system where data is either treated as gospel or dismissed entirely—there’s no middle ground of “useful but uncertain.”

What Actually Works

Fixing this requires more than better training. It requires structural change.

Start with data literacy for leaders, not just teachers. Principals and instructional coaches need to understand data deeply before they ask teachers to use it. This means dedicated professional learning, not a quick tutorial. Leaders should be able to articulate where data comes from, what assumptions it contains, what questions it can answer, and what questions it cannot. Only then can they create space for teachers to develop the same literacy.

Reduce fragmentation. If possible, move toward integrated systems where data from assessment, attendance, behavior, and engagement lives in one place. More importantly, create a single source of truth for student performance. Instead of conflicting dashboards, create a unified profile that shows where data agrees, where it conflicts, and where gaps exist. Make the contradictions visible so they become problems to investigate, not inconveniences to ignore.

Build interpretation into system design. Instead of raw dashboards, create systems that explain themselves. When a dashboard shows a metric, it should explain what the metric is, where it comes from, what assumptions underlie it, and what it does and doesn’t tell you. It should show confidence intervals or error ranges. It should explain the difference between what’s measured and what matters. This requires partnership between data scientists and educators to create tools that are useful because they’re transparent, not because they’re automated.

Create space for collective interpretation. Data literacy happens in community, not in isolation. Teachers should regularly examine data together, compare interpretations, test hypotheses, and collectively decide what’s real and what’s noise. This takes time—dedicated meeting time, not squeezed into lunch or after school. But it’s the only way to develop shared understanding and catch the errors that individual interpretation misses.

Use data to ask questions, not to answer them. Train teachers to see data as a starting point for investigation, not as a conclusion. A low score on an assessment is not an answer (the student is weak in fractions). It’s a question (what in this student’s experience led to this outcome?). A predictive flag is not a destiny. It’s a signal to investigate. This shifts the mindset from “the data says” to “the data suggests—now what do we need to learn?”

Hire and support data specialists. Schools should have people whose job is to ensure data is accurate, well-interpreted, and used responsibly. This might be a data director, assessment coordinator, or instructional technologist. But someone needs to own data literacy the way a literacy coach owns reading instruction. This person works with teachers to understand their data, helps leaders interpret system-level trends, and audits reports for bias and error.

Audit for bias regularly. Set up regular audits of disaggregated data. Which students are flagged for intervention? Which are offered advanced opportunities? Are patterns driven by need or by bias? This audit should happen in partnership with teachers, not imposed by administrators. The goal is to surface inequities so they can be addressed collectively, not to blame individuals.

Be transparent about what you don’t know. If you don’t know where a metric comes from, say so. If you’re not sure what a report means, investigate before acting. If a dashboard has gaps, acknowledge them. The pressure to appear data-driven should not override the responsibility to be honest about uncertainty. Teachers will trust data more if leaders model intellectual humility.

The Urgent Case

Schools are making billion-dollar decisions on the basis of data that teachers don’t understand and that leadership hasn’t examined. They’re flagging students for interventions, expanding or cutting programs, and investing in new platforms—all on the strength of dashboards that no one has taught anyone to read well.

This is not a technology problem. It’s a human problem. The data literacy crisis is not about having better data. It’s about building the capacity, infrastructure, and mindset to use the data we have responsibly and well.

The good news: this is fixable. It doesn’t require new platforms or new data. It requires time, intentionality, and a willingness to slow down and understand what we’re looking at before we act on it.

The bad news: most schools are moving in the opposite direction—adopting more platforms, collecting more data, expecting faster decisions. Until the incentives change, this gap will widen.

Verification: 1544cdbd1105873e